
Boland is a leading intelligent building technology and energy services provider in the Washington, D.C./Baltimore metropolitan area. Boland was generating dozens of energy analysis reports by hand every month for their clients. However, their report creation process was extremely manual and time consuming, and they needed a faster, more efficient way to aggregate and visualize energy data, and summarize building performance.
Key Reporting Challenges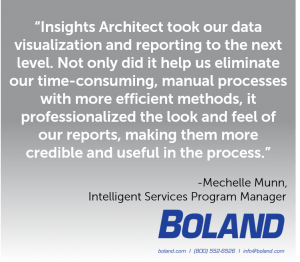
- Manual reports were time-consuming, labor-intensive and inefficient
- Template creation was not easily repeatable, resulting in inconsistent deliverables
- High-value employees wasted too much time cutting and pasting data from multiple sources to create individualized reports for specific clients and account managers
How Boland is Leveraging Insights Architect
Boland turned to EnergyPrint’s Insights Architect team to create two data visualization templates featuring the specific data they needed. The first template was a portfolio report with management-level metrics providing an at-a-glance view to easily compare buildings and quickly identify outliers. The second was a report focusing on individual building metrics. Boland’s account managers use these reports to more fully engage their clients and to prospect other services and energy improvement projects.
Download full case study.
Results
After launching Insights Architect custom reporting, Boland was able to:
- Replace their inefficient reporting structure with useful, consistent and easy-to-understand deliverables at both the individual building and portfolio levels
- Get on-demand access to highly polished reports for any client building or portfolio
- Save hours of high-value analyst and engineering resources every month
- Consistently engage clients with professional, insightful reports branded for Boland and aligned with their services