SPARK 2019: Does Your Business Have a High IQ?
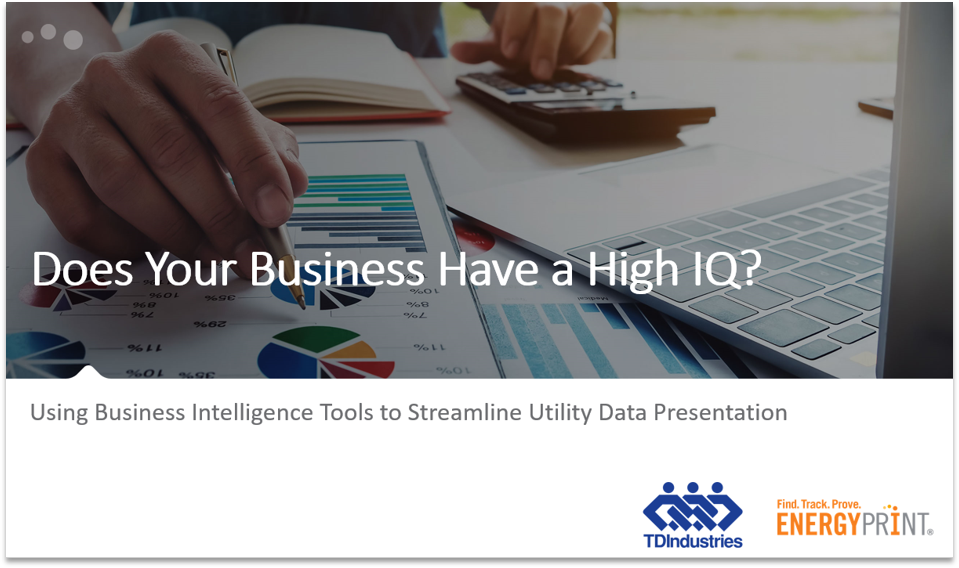
SPARK 2019 Video: EnergyPrint and TDIndustries discuss the role of business intelligence tools in using and presenting utility data.
SPARK 2019 Video: EnergyPrint and TDIndustries discuss the role of business intelligence tools in using and presenting utility data.
In this tutorial, you’ll learn how to create Comparisons to benchmark a building against itself, buildings from your portfolio, or peer buildings in the Utility Dashboard.
This tutorial shows you how to add Notes to the Property Energy Journal and manage them throughout the Utility Dashboard.
Learn how to benchmark ENERGY STAR® performance across your buildings and portfolios in the Utility Dashboard.
This Tutorial Video shows you how to leverage the Weather Profile in EnergyPrint’s Utility Dashboard. Learn how weather normalization works, and quickly see if weather is impacting your building’s energy performance.
This tutorial video walks you through how to use the Cost Avoidance feature in the Utility Dashboard so you can measure and prove ROI for your building improvements.
EnergyPrint’s Utility Dashboard gives you centralized access to your building portfolio’s energy analytics for you to explore and answer key business questions using metrics in real dollars and cents.
EnergyPrint sets the standard for how building professionals find and use energy analytics and utility insights to improve commercial building value and prove ROI.
Learn how navigate the Utility Dashboard, powered by EnergyPrint. This tutorial video gives you a complete software tour in less than 5 minutes.